PredictaBoard AI: Stock technical analysis tool with regression models
Overview
Investors and traders often need to switch between different websites, check historical charts, and calculate technical indicators manually to analyze stock prices. PredictaBoard AI simplifies this process by bringing everything into one dashboard. It collects real-time market data, calculates important technical indicators, displays interactive charts, and uses machine learning to predict stock prices for major technology companies, including Apple, Amazon, Microsoft, and NVIDIA.
Problem
Before PredictaBoard AI, analyzing stock performance and predicting future price movements required using multiple financial platforms, calculating indicators manually, and relying mainly on historical data.
- Scattered Market Data: Users had to visit different websites and financial platforms to track stock prices, making it difficult to compare major technology companies in one place.
- Time-Consuming Technical Analysis: Analyzing market trends required manually calculating indicators and comparing data across different time periods. This made it harder to understand market momentum and identify price trends.
- Limited Price Predictions: Traditional financial dashboards mainly show historical stock prices, offering limited insight into possible future price movements through machine learning.
- Limited Charting Flexibility: Some charting tools make it difficult to switch between an overall market view and detailed technical analysis, resulting in a less convenient user experience.
Solution
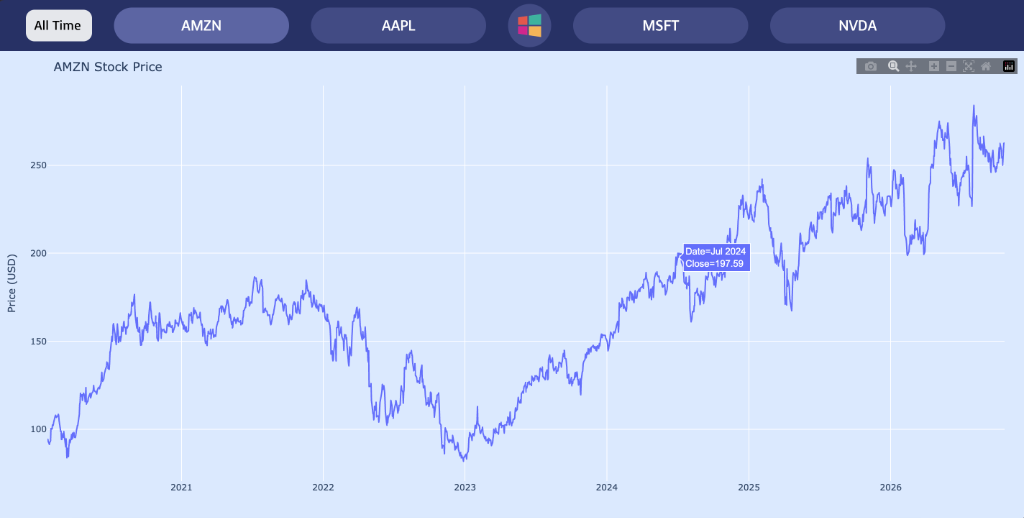
PredictaBoard AI is a full-stack financial dashboard that brings stock market data, technical analysis, interactive charts, and AI-powered price predictions into one platform.
 Click to zoom
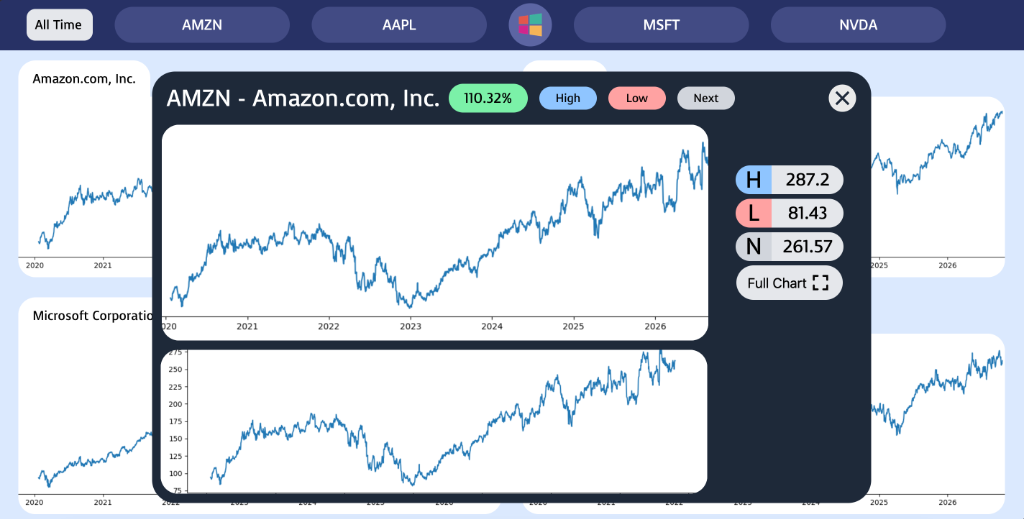
It uses Yahoo Finance to retrieve market data and combines a Python/Flask backend with Scikit-learn machine learning models and a React, TypeScript, and Express-based interface. Users can view stock performance across different time periods, including one week, one month, one year, and all time. They can also explore technical indicators, compare high and low prices, track percentage changes, and view predicted stock prices to support more informed investment decisions.
 Click to zoom
Evaluation
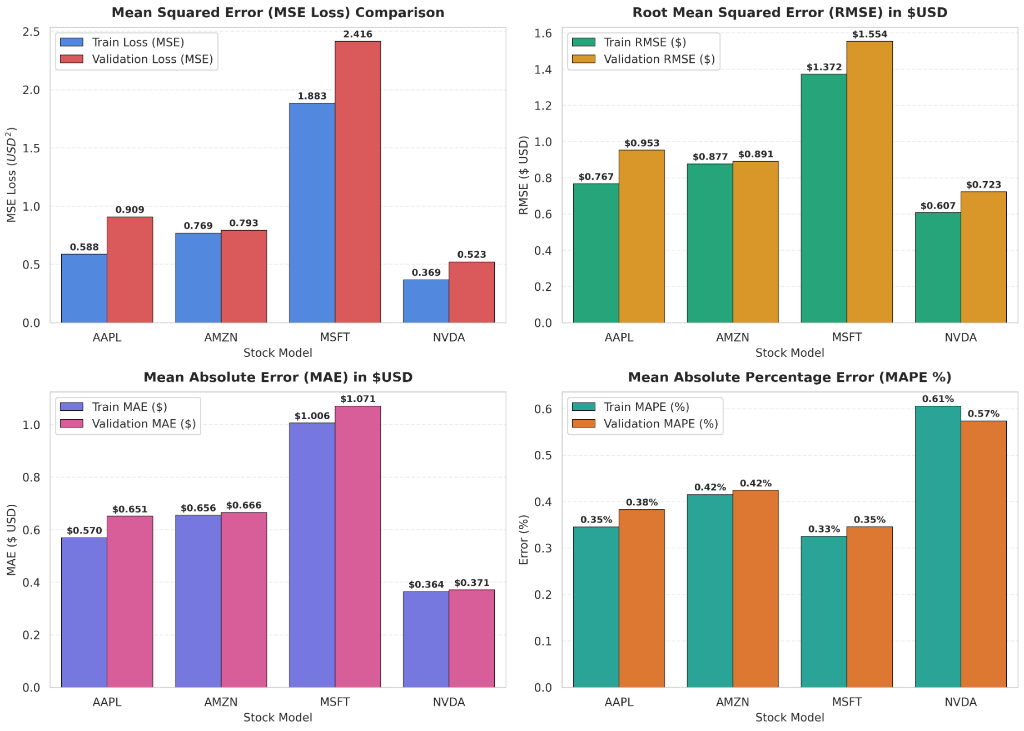
The regression models demonstrate high forecasting precision across all evaluated equities, maintaining Mean Absolute Percentage Errors (MAPE) well below 0.6% on both training and validation sets. Validation loss metrics closely parallel training curves across Mean Squared Error, Root Mean Squared Error, and Mean Absolute Error, confirming balanced model convergence without signs of overfitting. Even with higher-nominal assets like Microsoft, absolute dollar errors remain tightly bounded within ~$1.07 to $1.55.
 Click to zoom
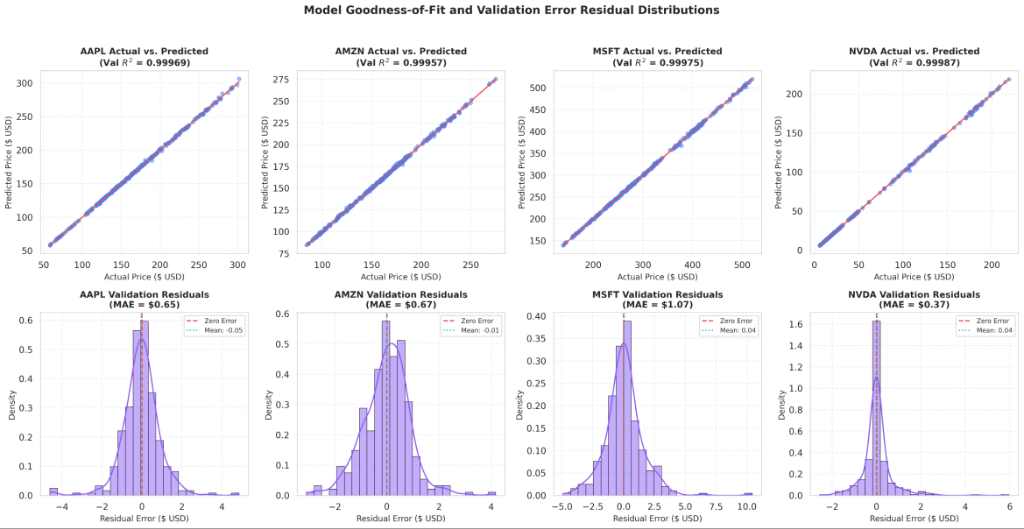
Scatter plots comparing actual versus predicted stock prices exhibit near-perfect alignment with the 45-degree identity line, achieving validation R² scores exceeding 0.9995 across all four tech assets. Corresponding validation residual distributions are sharply centered at zero with negligible mean bias ranging between -$0.05 and +$0.04. This bell-shaped error dispersion indicates symmetric predictions without systematic under- or over-estimation across shifting market trends.
 Click to zoom